Forecasting the Seattle Housing Market: 2023-2024
What's next for the Seattle housing market?
Below is a brief and accessible summary of my Capstone Project for my Master's of Science in Quantitative Economics (MSQE) at California Lutheran University (CLU). For a more detailed report and presentation deck, see files below:
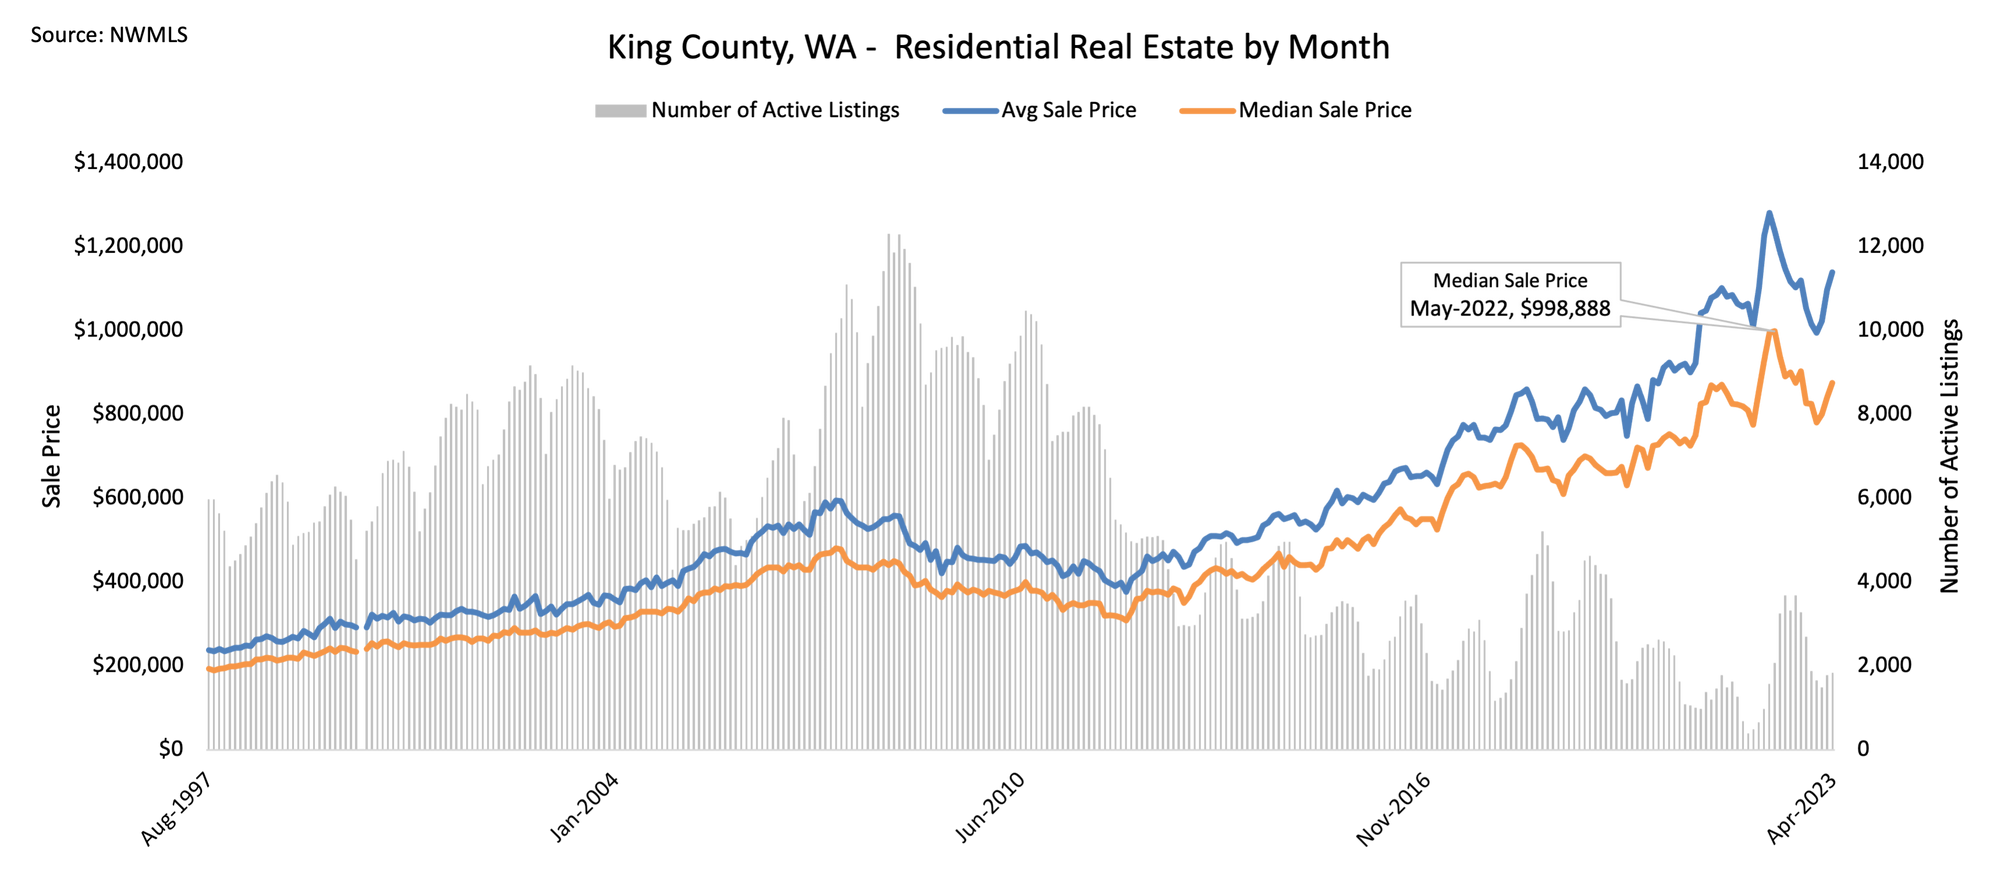
The Seattle housing market has taken off in the last 12 years with accelerated YoY price growth consistently above 10%. However, most recently, that growth has turned negative for a sustained period. What's next for the Seattle housing market?

I project that real (inflation adjusted) home prices for single-family residential homes in King County, WA will continue to fall in 2023 and reflect significant negative growth compared to 2022 or even 2021. It's likely that 2024 will see flat to modest growth compared to 2023. It's unlikely that 2024 will see a resumption of the 10-20% YoY growth that was emblematic of the 2010s. There is also a real possibility that negative growth continues in 2024, especially if Seattle area job growth slows or turns negative.
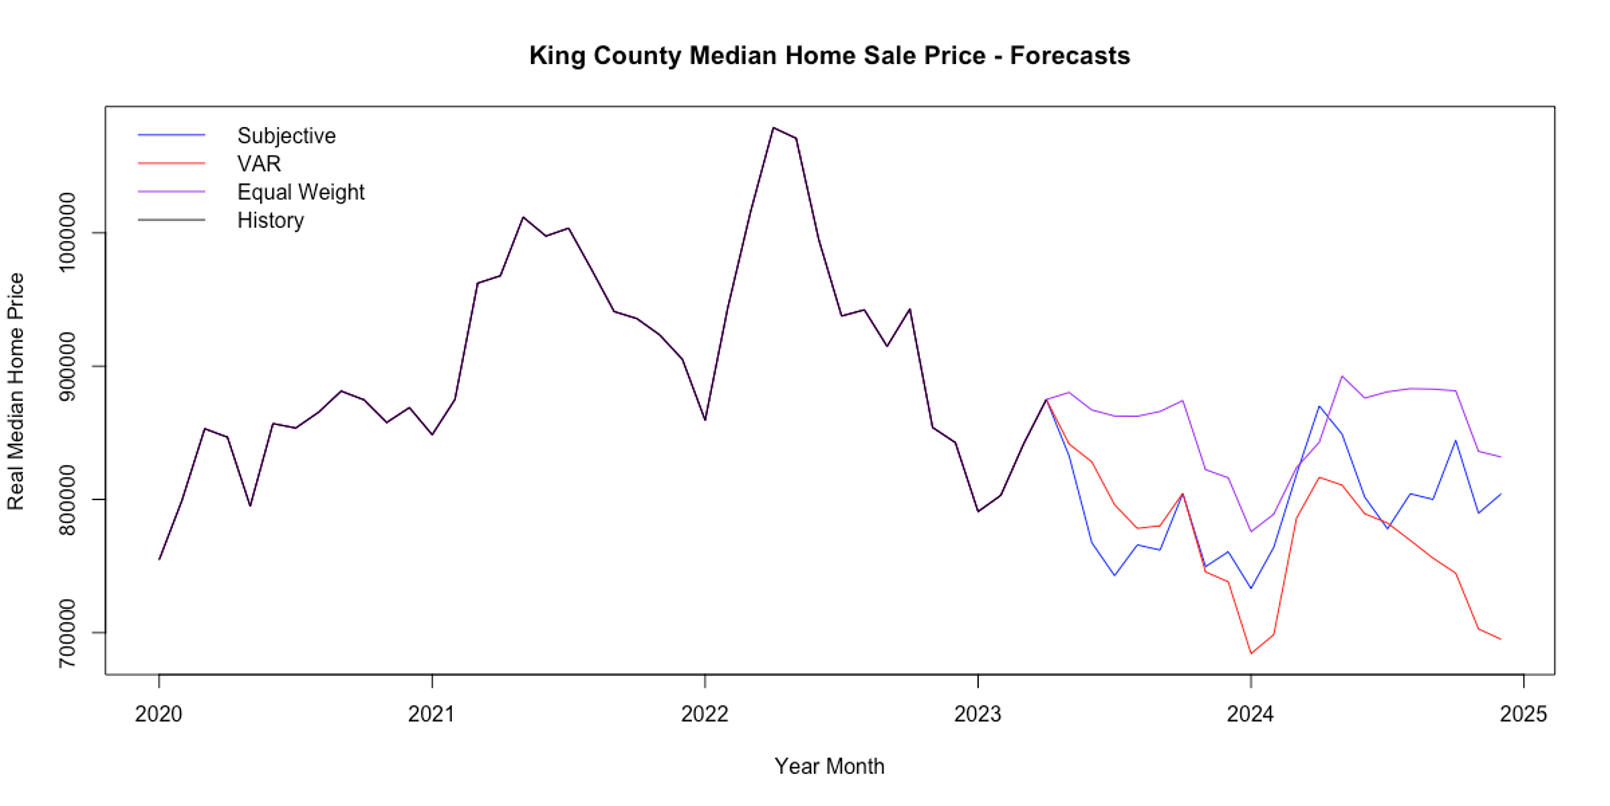
After exploring many different time-series techniques and combinations, three forecasts visualized below represent my preferred outlooks. (1) A 'Subjective' forecast, (2) a vector auto-regression (VAR), and (3) an 'Equal Weight' combination forecast that averages three different forecast methods (structural regressions in a muti-equation model, ARIMA, VAR). They are discussed in more detail below.

The 'Subjective' is simply a manually inputted "gut" forecast with very little math or coding involved. Mortgage rates have risen to 7% as of this writing and will likely remain close to that high throughout 2024. This sudden rise in rates due to The Fed's rapid policy shift to tame inflation has had the effect of constraining housing supply. Homeowners are loathe to trade a low rate for a high one. Low supply with ever-present demand has buoyed market prices in a time when high rates would normally put downward pressure on prices.
In 2022, we saw how a post-COVID market released almost 2 years of pent-up supply and demand causing a surge in both inventory and prices. Now a rate-related repression of supply has the potential to do the same as sellers come to terms with a new normal in mortgage rates. The needs of, say growing families and retirees will still necessitate property turnover. My intuition tells me this will occur in 2024 when The Fed likely finishes its rate hike cycle and/or pivots to rate cuts. Increased inventory will tamp down prices, but the resiliency of the Seattle market will counteract any downward pressure as demand continues to outstrip supply. Thus, I would expect to see historically average price growth in the 5-7% range for 2024.
VAR (Vector Auto-Regression) is forecast technique that allows variables to interact with each other. Instead of the direction of causality going one way (e.g. low inventory causing high prices), VAR allows for a more dynamic model where inventory and prices both influence each other. The VAR model I specified performed well when predicting past known values. In particular, it most closely predicted the recent downturn in the market in early 2023. The VAR forecast is the most "bearish" of different forecasting methods showing that 2024 would continue to see YoY price declines. A very real possibility.
In addition to VAR and Subjective, I created a combination forecast that averages three forecast techniques together with equal weights. One, the aforementioned VAR. Two, an ARIMA model that statistically looks at cyclical patterns and correlations in only the price variable, not taking into account other variables (jobs, mortgage rates, etc.). And finally, a muti-equation model made up of structural regressions (Newey-West standard errors) that had causal right-hand-side variables agreeing with economic theory (e.g. more jobs means higher prices, higher stock prices will result in higher prices, higher mortgage rates lower prices, etc.). The 'Structural' model was the most scrutinized and time-intensive to specify. It was also the only forecast method with an optimistic outlook, showing that the accelerated growth of the past decade would resume after somewhat flat 2023 growth.
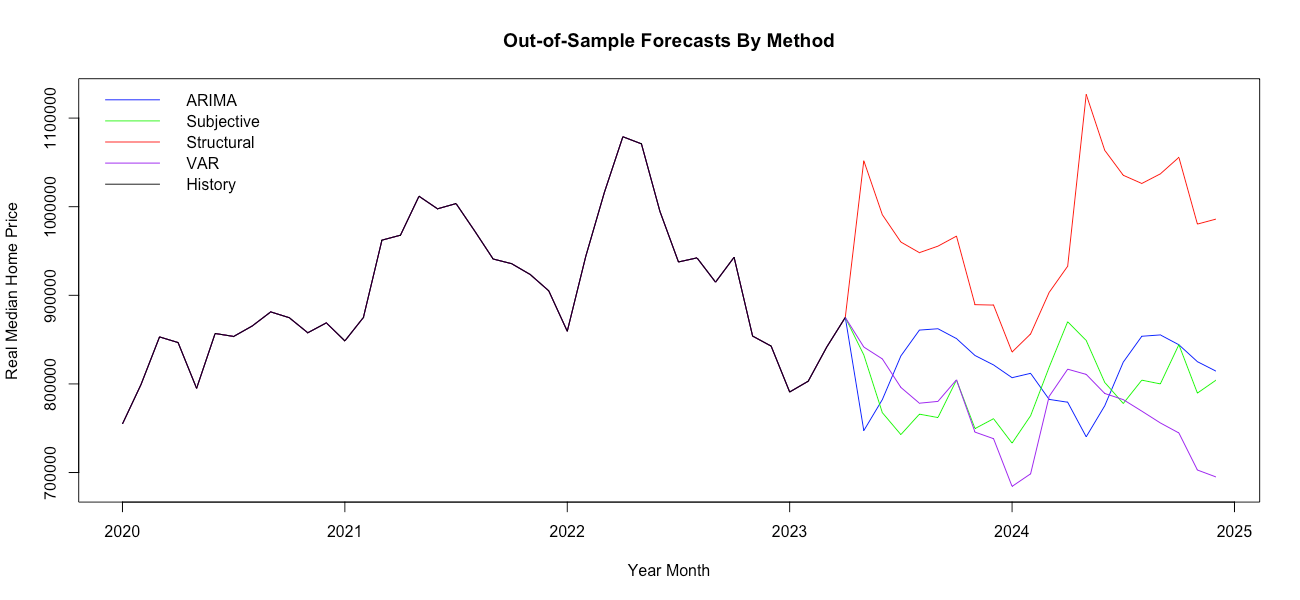
Equal weight forecasts have shown to be surprisingly accurate because they incorporate different information and signals from different techniques each with their own strengths and weaknesses. Averaging them reduces the error caused by each techniques short-comings. My 'Equal Weight' forecast has the effect of averaging an optimistic 'Structural' and pessimistic VAR, to a "Meh." combination forecast projecting relatively flat growth in 2024.
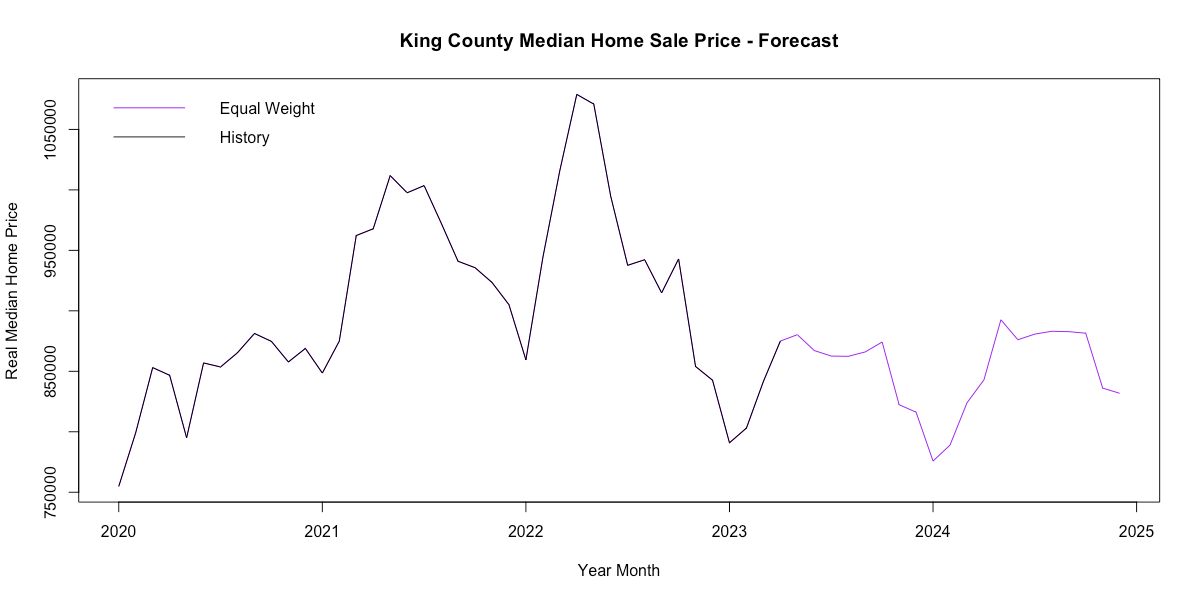
A reminder that these prices are in real terms indexed to April 2023 dollars. That means flat real growth may still be nominally positive when taking into account projected 2-4% inflation. A table of this forecast and it's performance thus far is at the end of this post.
What does this mean for buyers and sellers?
Buyers could interpret this as a good time to buy if they find a property that meets their needs. There likely won't be a moving target on home prices in the next year and a half as prices stabilize. But low inventory means it will be harder to find properties that check all the boxes. Pent up inventory may release next year. Mortgage rates will stay high pricing many out of the market. There's no guarantee rates come down in 2024.
Would-be sellers may see this forecast as reason to hold on to their investment in the short term until accelerated growth returns. But it's somewhat uncertain whether the market will improve significantly. A strategy like waiting to 2024 to sell a property that is ready now has a very real chance of not yielding any price benefit.
Below is a table of the equal weight forecast which I'll periodically update and assess for accuracy.
| Month | Actual | Forecast | Forecast Error | % Forecast Error |
|---|---|---|---|---|
| May 2023 | 910,000 | 886,962 | (23,038) | 2.5% |
| June 2023 | 935,000 | 879,754 | (55,246) | 5.9% |
| July 2023 | 897,500 | 878,487 | (19,013) | 2.1% |
| August 2023 | 906,250 | 881,644 | (24,606) | 2.7% |
| September 2023 | 900,000 | 884,993 | (15,007) | 1.7% |
| October 2023 | 882,997 | 893,012 | 10,015 | 1.1% |
| November 2023 | 885,500 | 843,787 | (41,713) | 4.7% |
| December 2023 | 849,950 | 840,899 | (9,051) | 1.1% |
| January 2024 | 849,850 | 801,681 | (48,169) | 5.7% |
| February 2024 | 914,500 | 817,758 | (96,742) | 10.6% |
| March 2024 | 945,500 | 853,640 | (91,860) | 9.7% |
| April 2024 | 980,000 | 873,051 | (106,949) | 10.9% |
| May 2024 | 1,001,000 | 926,249 | (74,751) | 7.5% |
| June 2024 | 965,000 | 910,524 | (54,476) | 5.6% |
| July 2024 | 999,000 | 916,465 | (82,535) | 8.3% |
| August 2024 | 955,000 | 919,932 | (35,068) | 3.7% |
| September 2024 | 950,000 | 919,468 | (30,532) | 3.2% |
| October 2024 | 918,010 | |||
| November 2024 | 871,369 | |||
| December 2024 | 867,426 |