How Much Does Your State Rely on Property, Sales, & Income Taxes?
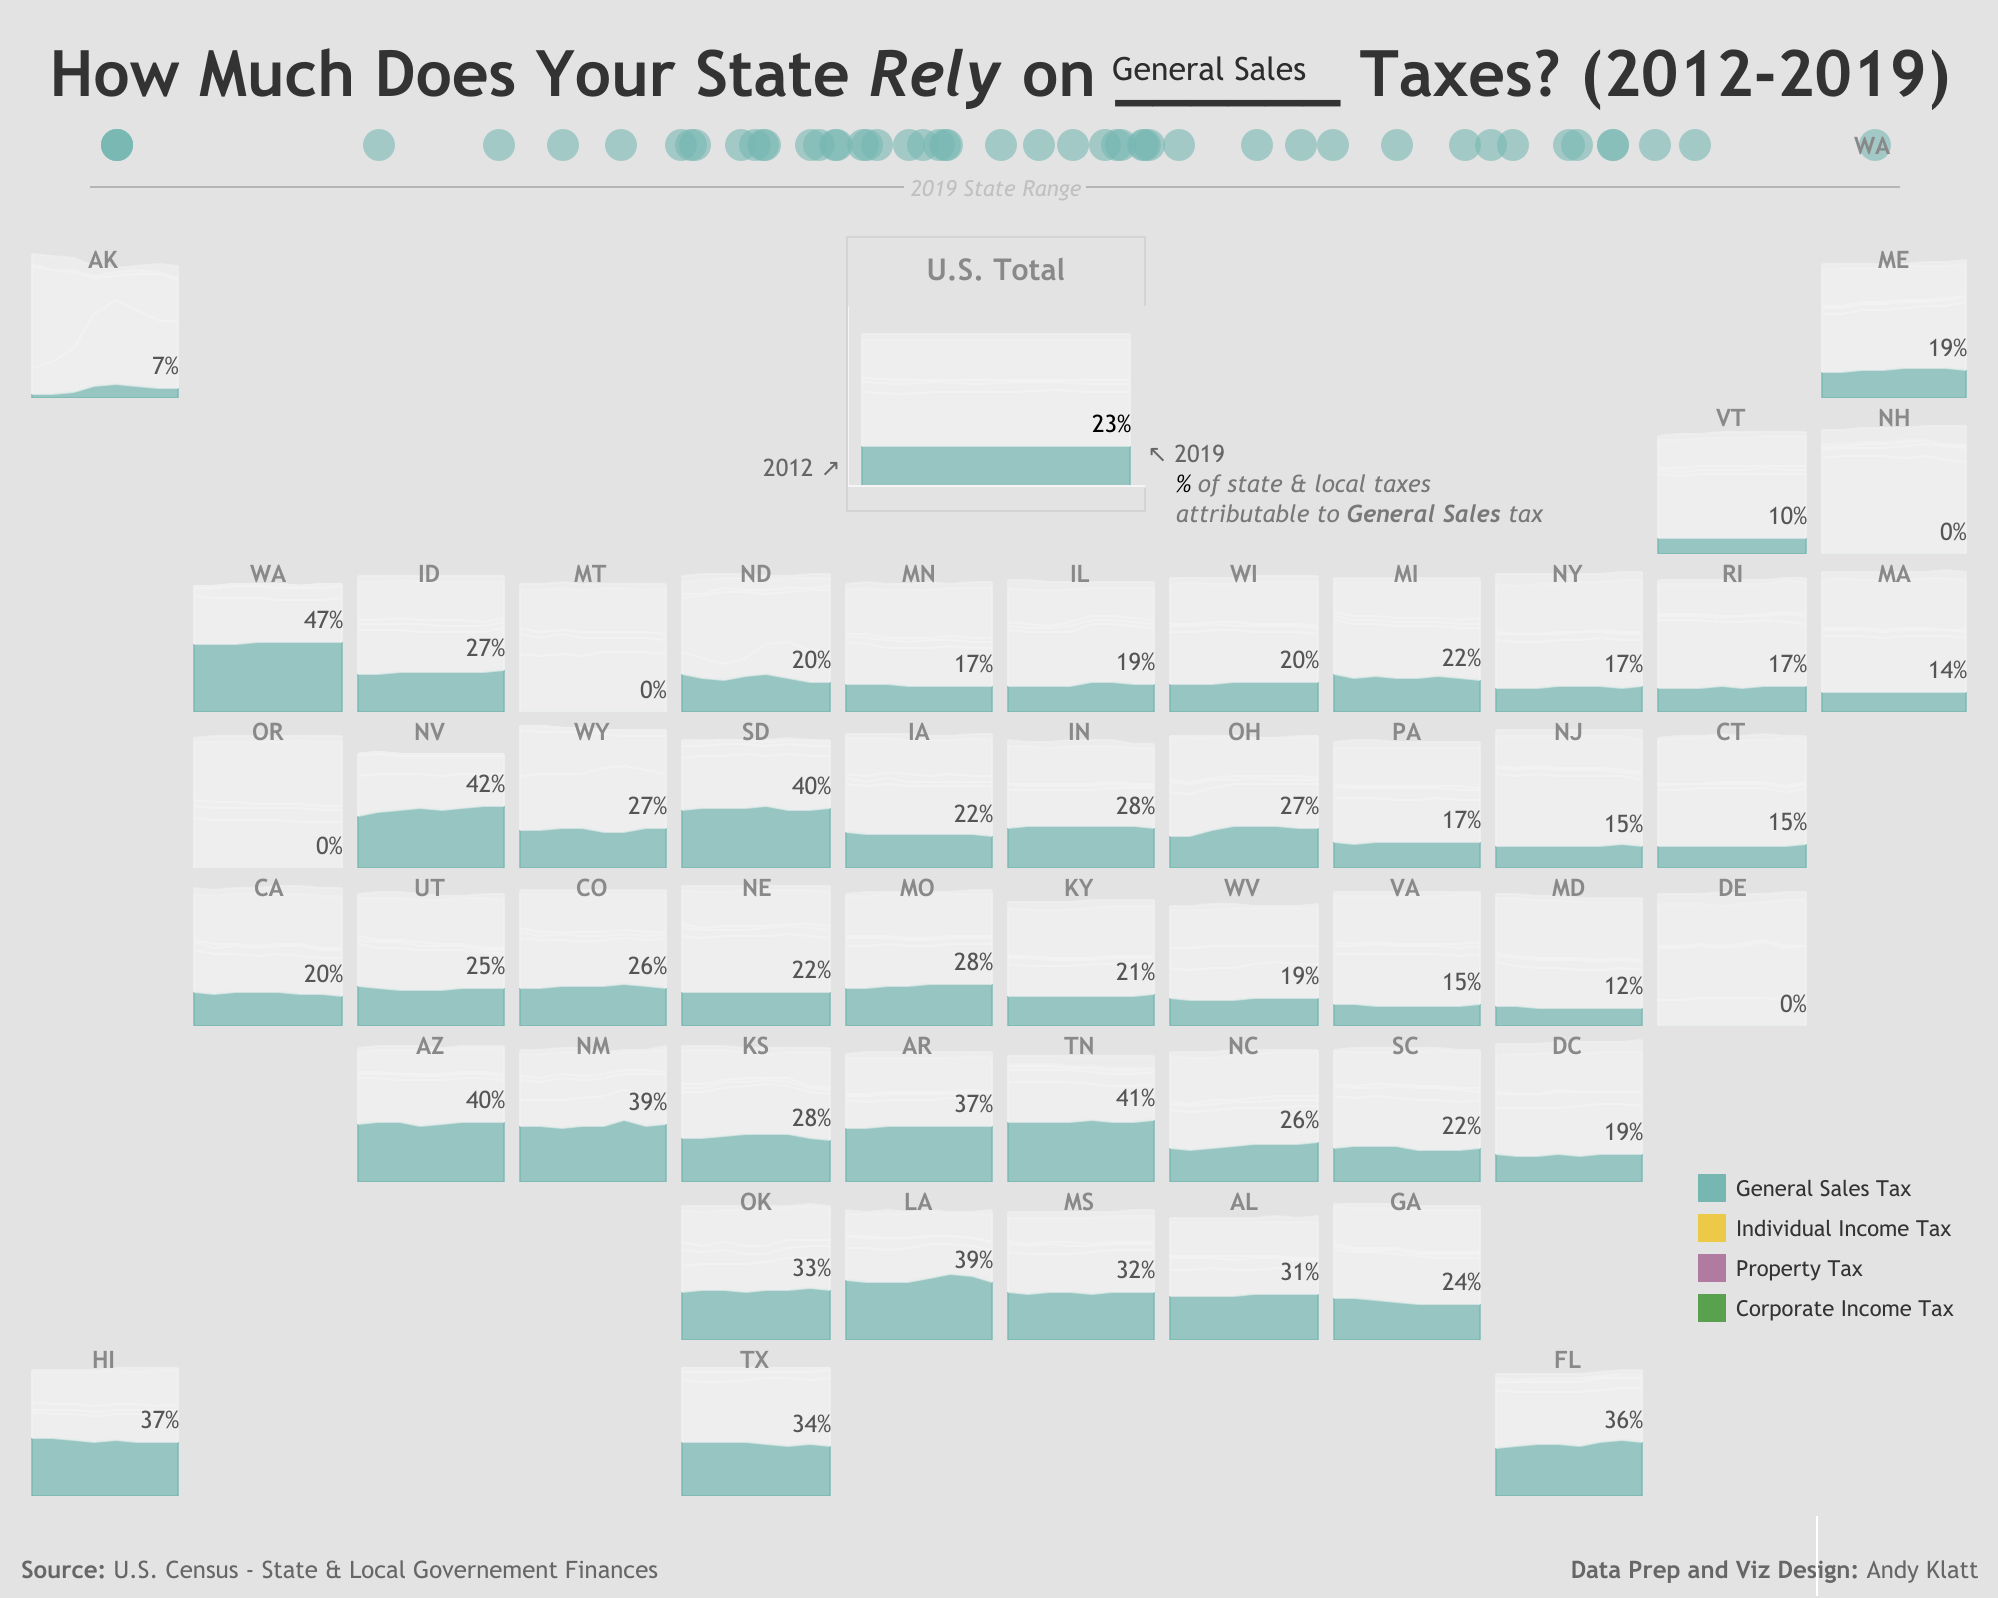
I live in the state of Washington which has no state income tax.
Instead, the state largely relies on sales tax revenue to fund state and local public services like education, utilities, etc.
Meanwhile, across the Columbia River in Oregon they have no sales tax, but the highest state income tax rates in the country.
Property tax is usually the third leg of this state tax revenue stool.
I was inspired to visualize these differences in state policies as a first step to understand why states rely on different compositions of tax revenue.
See below:
State and local policy makers are empowered to determine how their inhabitants pay for state and local public services: at the checkout counter, with their paycheck, or tax property owners.
Sales and Property taxes are regressive taxes because they are disproportionately affect low-income earners. Whereas, most income tax systems are progressive taxes because they take a greater percentage from higher income earners. Each tax revenue stream involves economic efficiency and equity trade-offs that deserve more in-depth analysis.
For instance, does population or other state characteristics determine tax type reliance? More analysis to come.
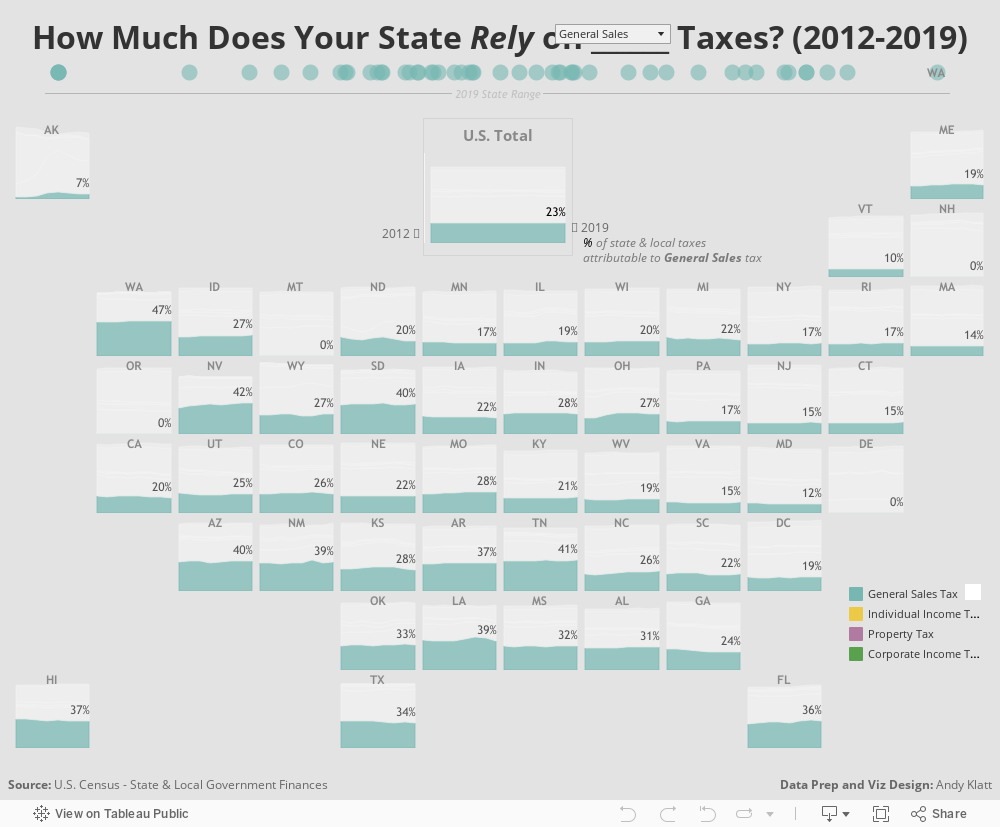
I was inspired by a few sources to create the interactive data viz above. Firstly, I wanted to create a tile map similar to Matt Chambers' (@sirvizalot) presidential voting viz where states are visually given equal visual space (no need to squint or have annotaion call outs for states like CT, RI). Also, each tile can display area charts as a next level analysis to see how these state's reliances have trended over time.
The Tax Foundation also routinely publishes similar analyses that compare state tax reliances. I was inspired after finding articles like this one by Janelle Cammenga and taking on the challenge to improve the visualization with an interactive tile map.
The source of this data are the U.S. Census Bureau's State & Local Government Finance tables.
I used Tableau Prep builder to transform these tables over multiple years into something that Tableau could more easily visualize. It was a great use case for exploring all the data cleaning capabilities of Tableau Prep Builder.